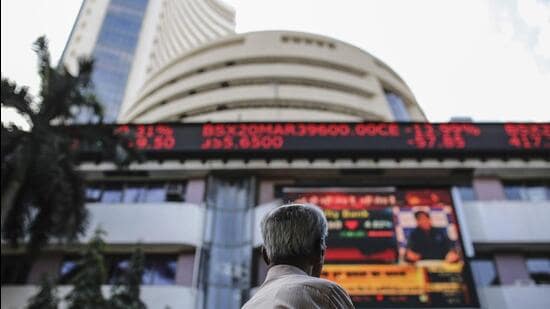
The first two parts of this three-part data series looked at the state of consumption and investment in India in 2022-23. The concluding part summarises the activity in capital, commodity and currency markets for the Indian economy in four charts.
A volatile year for equity markets
In nominal terms, 2022-23 was a decent year for BSE Sensex as the index closed 422.9 points higher on March 31, 2023 from a year ago. In percentage terms, the Sensex moved higher by only 0.7% in 2022-23, the worst performance in the past three years. To be sure, the stock market saw a lot of volatility through the year. It had a poor performance in the first half of the fiscal 2022-23, gained momentum in the second half and suffered heavily after the release of Hindenburg report on Adani Group of Companies on February 1. BSE Sensex lost 745.9 points in the month of February. However, the market recovered in March to close higher than last year’s value.
To be sure, 2022-23 has done away with some of the exuberance which has been typical of Indian equity markets in the past few years. The PE multiple – it measures the ratio of stock price and profits per share – for BSE Sensex fell from 25.77 on March 31, 2022 to 22.4 on March 31, 2023. The fall is much sharper if one compares the average during the entire fiscal (22.9 in 2022-23 from 29.5 in 2021-22). The 2022-23 PE multiple value is also the lowest in the past four years.
See Chart 1: BSE Sensex
India is in the middle of the pack among ten major stock markets in the world
A cross comparison of BSE Sensex with 10 major world-indices (across 10 countries) shows that India’s stock market performance was not the worst amongst all. Asian economies such as Korea, Hong Kong, Singapore saw a sharper fall in their stock metrics in the last fiscal, while BSE Sensex’s performance was at par with Shanghai’s SSE and Japan’s Nikkei 225. Overall, it had the fifth best performance in the world.
See Chart 2: Growth in major world market indices in 2022-23
2022-23 promised gradual relief on energy prices
The Russian invasion of Ukraine in February 2022 led to a sharp increase in international commodity prices. Data from the ministry of petroleum shows that the price of Indian basket’s crude oil surged to $116 per barrel in June 2022 from $94 per barrel in February 2022. The subsequent months recorded a cooling of oil prices and it ended at $78.3 per barrel on March 31, 2023. This gradual moderation raised hopes that energy prices would be benign in 2023-24 which will conclude with the 2024 general elections. However, the surprise decision by the Organisation of Petroleum Exporting Countries’ (OPEC) to cut oil production (by around 1.16 million barrels per day) has led to a sharp increase in crude oil prices in April and most analysts have made upward revisions to their oil price forecasts.
See Chart 3: Price of Indian crude oil basket
Indian rupee was the Emerging Market Asia’s worst performer
The Indian rupee ended this year’s last trading day on March 31 as Asia’s worst-performing currency. The Indian Rupee declined by 8.4% against the US dollar over the last fiscal, followed by Chinese yuan (8.3%), Korean won (7.9%) and Taiwan dollar (7.1%). Only the Singapore dollar appreciated in value by 1.7% against the dollar over the same period. Other emerging market currencies such as Malaysian Ringgit, Indonesian Rupee, Philippines peso, Thai Bhat and Hong Kong Dollar suffered a depreciation of 5% or below. To be sure, the depreciation in Asian currencies is more a result of an appreciation in the dollar’s value due to interest rate hikes in the US than a reflection of economic fundamentals in individual countries. The rupee could have lost more value without RBI’s intervention in foreign exchange markets. India’s foreign exchange reserves – RBI’s currency market interventions use this – went down by $30 billion in 2022-23 (till March 24).
See Chart 4: Rupee depreciation against Asian currencies


